Methods and Materials
Several processes are necessary to analyze the mitigating effect of creatine on doxorubicin-induced inhibition of muscle regeneration. Animals (rats) must be treated with control (doxorubicin) and no added supplement to food pellets. Experimentally treated rats will also be administered doxorubicin but instead food pellets will contain varying concentrations of creatine. All procedures were approved by the Institutional Animal Care and Use Committee and carried out in accordance with the Animal Welfare Act. Rats were housed in an environmentally controlled facility with a 12 hr day/night cycle. Rats were allowed to consume water and rodent chow as they wish. Said rats were sixty Sprague-Dawley rats obtained from Harlan Laboratories of age ten weeks and average weight roughly 300 g (N=47). Rats were randomly assigned to control, doxorubicin, and creatine & doxorubicin groups. The creatine & doxorubicin group was fed chow supplemented with 3% creatine monohydrate and the control and doxorubicin groups received standard rodent chow. After two weeks on the stated diets, the creatine & doxorubicin as well as the doxorubicin groups received a bolus (15 mg/kg) intraperitoneal (i.p.) injection of doxorubicin and the control group received an intraperitoneal saline injection as a placebo. Five days afterwards, each animal was anesthetized with heparinized (100U) sodium pentobarbital (50 mg.kg) and the heart, right soleus, and right extensor digitorum longus was excised, weighed, frozen in liquid nitrogen, and stored at -80°C. It must be noted that rats were only sacrificed until after the tail pinch reflex was entirely absent. These techniques include but are not limited to anesthetic during sacrificial procedure and proper care for the rats within their habitations (ample space, water, and food should be provided). At regular intervals during the treatment, rats from all groups will be tested for grip strength; rats will be lifted by the tail by a trained researcher, and in response, the lifted rat will grip onto a specialized digital scale. The researcher will continue to pull the rat until the rat will no longer be able to hold onto the device, and the resulting output (in Newtons) will be recorded. This process will be repeated several times. These rats will later be sacrificed and calf (solis) muscle tissue from both legs will be obtained. This muscle will be first “hung” and tested for maximal strength. A quantitative measure of the maximal output (Newtons) for each muscle will be obtained. This muscle cell tissue will then be cut, stored in eppendorf tubes, and refrigerated at -70℃. Tissue homogenization will follow. Individual samples will be recruited from refrigeration at -70℃ and then weighed. If samples do not weigh between .07 - .1 g, then tissue must be discarded until the desired amount is available. This tissue is then placed into a glass mortar. For every hundredth of a gram, 10µL of Radioimmunoprecipitation (RIPA) buffer as well as protease inhibitors are added to the mortar. This tissue, submerged within RIPA buffer and protease inhibitors, must then be mechanically homogenized until all color is lost from the sample. This tissue must then be sonicated ten times in one-second bursts. After sonication, the tissue is then homogenized mechanically with a pestle twice. The resulting fluid, without tissue, is poured from the glass mortar into an eppendorf tube. This eppendorf tube is labelled with the necessary identifying information that will allow determination of the organism and specific location within the organism from which the tissue was obtained. The sample is then immediately stored at -70℃. Once a sufficient amount of samples have been obtained to fill a centrifuge, samples are centrifuged at 10,000 RPM, 3000g, and 4℃ for 10 minutes. The supernatant is collected into another eppendorf tube as the tube containing both the pellet and supernatant is inverted. Afterwards, the eppendorf tube containing the pellet is discarded as the proteins of interest reside within the supernatant. The eppendorf tube containing the supernatant is then labelled with the same identifying information as the eppendorf tube. In order to standardize total protein concentration within the samples, a Genesys 20 photospectrometer (562 nm) was used to determine the concentration of proteins within the samples. RIPA buffer is added as needed to standardize concentration and labelled eppendorf tubes are stored at -70℃.
Equal volumes of Lammeli buffer are added to samples in microcentrifuge polypropylene vials. Protein concentration is reduced in half. Samples are heated in boiling water for two minutes then chilled on ice for 5 minutes. 46 ug are loaded onto 4-10% gradient tris-glycine NuPage precast cells obtained from LifeTechnologies in Carlsbad, California. Gels were run at 125 V and 4 mA for two hours in an Xcell II blot module obtained from Invitrogen LifeTechnologies. The process should be terminated when proteins have migrated through the whole gel.
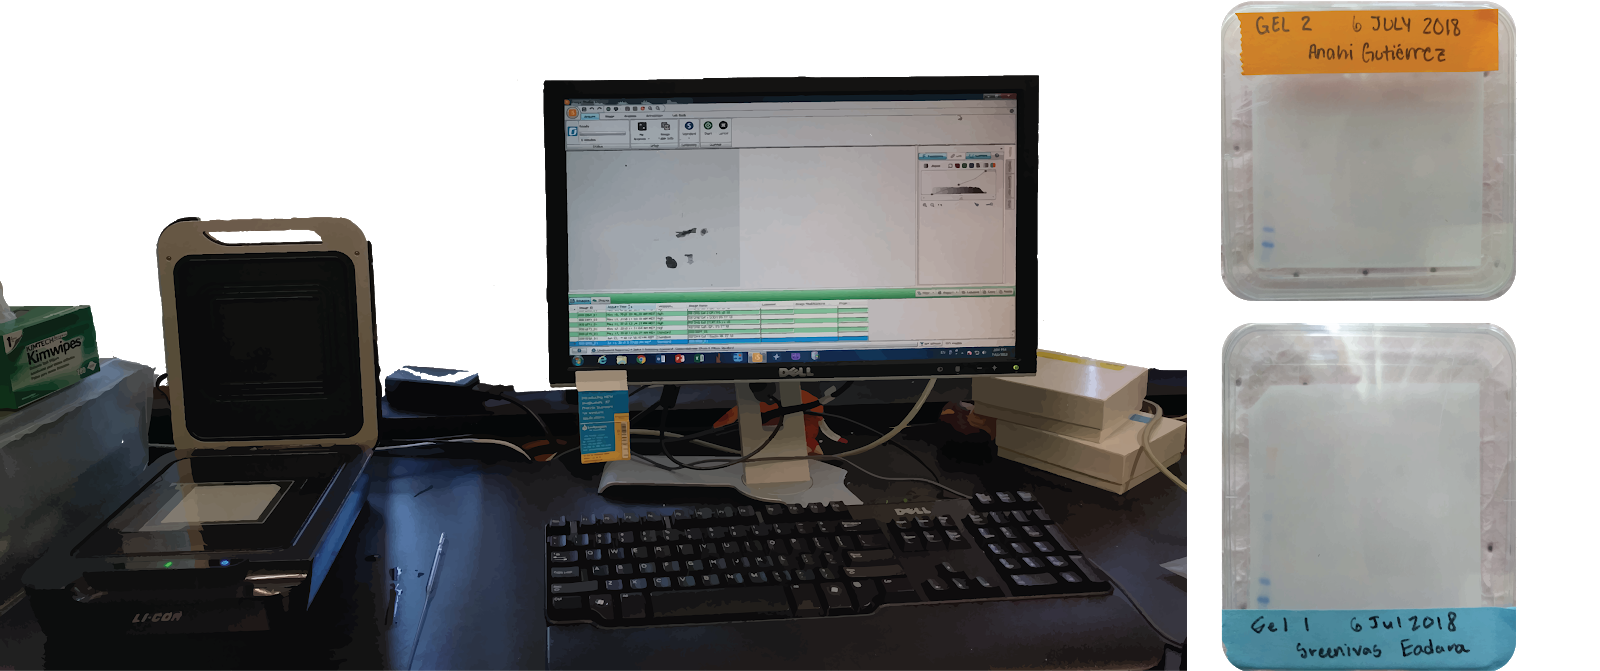
The gel must be labelled such that the wells and their contents can be identified after electrophoresis and X-ray photography. For the purposes of this electrophoresis, 5 µL SeeBlue (Pre-Stained Standard) is added to the first well (Leftmost) so that the progression of the electrophoresis can be visualized. For ease of use and for accuracy, micropipette tips are held into ¾ the depth of the well and then the contents are purged slowly. The identification information on each eppendorf tube is recorded and the samples are stored in order on a silicone grid. Numbers are assigned to each sample that will correspond to a well number. Each sample is stored in order of well number on the silicone grid. The numbers corresponding to each sample are then written on the plastic cover of the gel. After all the samples have been labelled and micropipetted into the wells, the last well adjacent to the rightmost sample is micropippeted with 5 ul of Magic Marker (ladder). At the conclusion of two hours, the blue dye present within each sample should be visible within the foot of the gel. The electrophoresis module is deactivated and then the gel within its plastic container is removed. With a “prying” motion, a gel knife is used to separate the top plastic casing from the gel as well as the backing. To separate the gel from the backing, the gel with the foot is turned over into a gloved hand or a flat surface and the plastic backing is gently lifted. The foot of the gel is cut off and then discarded. In order to preserve the gel, the gel is continuously wetted with TBST. In order to prepare the transfer membrane, the .45 micron polyvinylidene flouride membranes are submerged in methanol and then DI water. 4 blotting pads, 2 filter papers, the transfer membrane, and the gel are loaded into a Transfer module as per the figure above, and the transfer is run at 25V for 100mA for 90 minutes. The gel is then discarded and the transfer membrane, now containing proteins, is blocked for 1 hour in a mixture of 15Ml TBST and 5% milk. Afterwards, 10 mL primary antibodies (rabbit monoclonal MyoD) are added to the membranes and the membranes are rocked overnight within the 10mL solution. The TBST and milk mixture is discarded. The membrane is washed by gently agitating the membranes in TBST on a rocker thrice for five minutes each time. Secondary antibodies obtained from Santa Cruz Biotechnology that correspond to the monoclonal MyoD primary antibodies are added to the membrane along with horseradish peroxidase and the solution and membrane are incubated for 1 hour. The membrane is then washed three times for five minutes in TBST and then photographed in the C-DiGit Blot Scanner for Chemiluminescent Westerns. This is accomplished by adding 1.5 mL of luminol and enhancer from the SuperSignal West Femto Maximum Sensitivity Chemiluminescent Substrate kit from ThermoScientific in Waltham, Maryland. ImageJ software is used to analyze particular sections of the photograph for the relative concentrations of a particular protein, since the molecular weights of the proteins of interest are known. The optical density of the image at the expected location of a particular protein (as deduced by the location of several markers in the MagicMark ladder) is indicative of its concentration.